 |
PHONE 626-337-2800 |
Finepitch Electronic Assembly Announces Newly Redesigned Website - www.finepitchassembly.com Automated Optical Inspection (AOI)
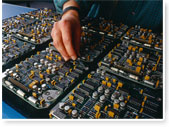
Finepitch Electronic Assembly is equipped with top of the line Mirtec AOI. Automated Optical Inspection (AOI) is a powerful tool for assessing workmanship compliance in Prototype as well as Production PCB assembly environments. With advanced lighting, optics, and image processing capabilities, the machines greatly enhance inspection repeatability, accuracy and throughput. AOI plays a vital role in test strategies designed to ensure the highest possible quality throughout each phase of a products life cycle.
Automatic Optical Inspection (AOI) addresses ever-increasing density, diversity, and quality requirements of PCBs by maximizing resources to increase production efficiency in a competitive business that leaves little margin for error. AOI eliminates the subjectivity and variability necessarily associated with manual visual inspection. Systems are integrated into the automatic assembly processes to provide 100% visible component and solder-joint inspection. Leaded/Leadfree Reflow processes
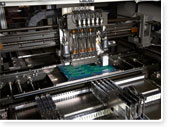
Finepitch Electronic Assembly is equipped with one of the top soldering specialist Seho Reflow Oven capable of running 24/7.In table 2 typical parameters for reflow soldering, again adapted to the different solder alloys, are shown. 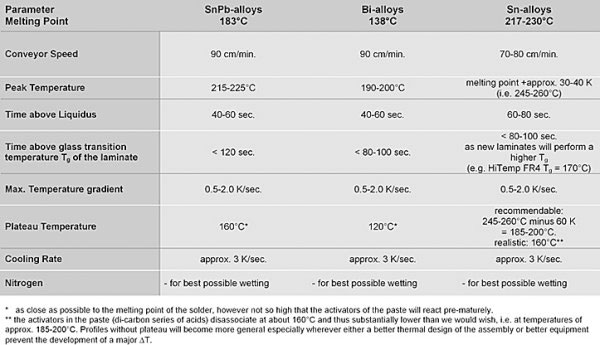 Hi-melting pastes will narrow down to the two families SnAg+X and SnAgCu+X as the melting point of SnCu+X will be considered too high. Their thermal process profiles will shift to higher temperatures (see pic. 2 reflow soldering profile for hi-melting solder pastes). The peak temperature ranges at about melting point of the alloy plus 30-40 K, hence approx. 245-260°C. Peak temperature of about 235°C abound in the literature and they may be quite feasible under excellent nitrogen inertion. However, due to solderability problems encountered on components and boards and the general lack of good wetting properties for the lead-free alloys, we anticipate a slow adjustment of the peak temperatures in the area mentioned above. Choosing the best plateau - temperature - as close as possible to the melting point of the solder (approx. 220°C), however not so high that the activators of the paste will react pre-maturely - most likely is one of the most difficult conditions to meet. The activators in the paste (Di-carbon series of acids) disassociate at about 160°C and thus substantially lower than we would wish, I. E. At temperatures of about 245 - 260°C minus 60 K = 185 - 200°C. Profiles without plateau will become more general especially wherever either a better thermal design of the assembly or better equipment prevent the development of a major ΔT. On the other hand, we do not yet have reliable information about the effect of an increased thickness of the intermetallic layer on the reliability of the lead-free joint. Thus we do not even know whether a large ΔT will have a negative impact on the reliability as in the case of SnPb. Perhaps we do not have to react to large ΔTs (except perhaps for components) as before and we might be able to use the pyramidical profile without paying the Δt-price? Reflow/Wave Solder Tracker System
The Datapaq Reflow Tracker continues to set the industry standard for ease-of-use and reliability in thermal profiling. Ideal for reflow, wave solder, vapor phase, tack/cure, rework stations, solder mask ovens and high temperature furnaces.Temperature profiling is the process of recording and interpreting temperatures of products and/or air through a conveyorized process (or during a batch process). The data is displayed as a graph/profile and as numeric data. In its simplest form this information tells you how hot your product became and for how long, and what temperatures it reached and at what point. Process Engineers know what the perfect profile for their product should be, variations from the ideal indicate a potential problem or unacceptable quality. By analyzing the profile you are able to verify products are of the highest quality, increase throughput, and solve production problems. Why should I profile my process? Your oven, furnace or kiln is the heart of your business. The quality and reliability of your finished product depends upon its performance. You know a lot about every other manufacturing step in your operation, but do you really know whats going on inside your conveyorized oven or furnace? If production is going well, great! But can you make it better? Can you take immediate corrective action when its not going well? Do you have information to prevent problems? Wouldnt you like to? Routine temperature profiling gives you reliable data to optimize your process, prove process control and make corrections when required. But today compliance and traceability are key issues. A product report proving compliance to manufacturing specifications may not yet be a requirement but it is likely to be a major selling point for your product. You dont question why your doctor takes your pulse and blood pressure, do you? Its the same thing for your production line, a product report proving compliance to manufacturing specifications is like getting a clean bill of health from your doctor. Routine profiling can help you:
What are the benefits of profiling?
Rapidly setup new processesRoutine monitoring of your process gives you a database of profile information which will help you develop new processes accurately and efficiently. Youll know exactly what temperature settings and line speed will give you the best quality product. Identify problems before they affect quality Statistical Process Control functions identify potential problems allowing you to schedule preventative maintenance at your convenience. Find faults quickly When problems occur because of improper heating, youll quickly spot the cause and location. Analyze the profile information to determine necessary corrective action, then run follow-up profiles to prove the changes were successful. Increase productivity Analysis of your profiles will show you how and where you can optimize operations. By rebalancing the time at temperature and heat ratios you may be able to increase line speed and product throughput. And by knowing exactly what is happening to your product in your process youll be able to minimize time spent on test runs and process setups -- allowing a greater number of profitable production runs. Prove process control (QS/ISO9000) Our single page standard report is only one way our Tracker Systems prove process control -- all the data files are fully traceable as well. Each includes operator name, product type and data logger serial number in addition to temperature information to prove that your process is being performed in a controlled and repeatable manner every day. Minimize fuel costs Rising fuel costs can significantly impact your operating budget. The simple fact is that lower costs mean higher profits. Every Tracker System gives you the information you need to make the best possible product with the highest efficiency, I.e. Less heat equals less fuel. And less fuel consumption also has a positive environmental impact! Control product quality A growing scrap pile or increased customer returns means only one thing - something has gone wrong. If you know precisely what is happening to your products during production you can easily reduce rejects, reduce rework, reduce scrap and reduce returns. Prevention is not as exciting as solving a problem once it has occurred, but its a lot more profitable. Makes sense, doesnt it? |
|
 | |
©2009 FinePitch Electronic Assembly | |